Interactive InfoGraphics | 2014.07
2014.07
Information architect, Graphic designer
PS, AI
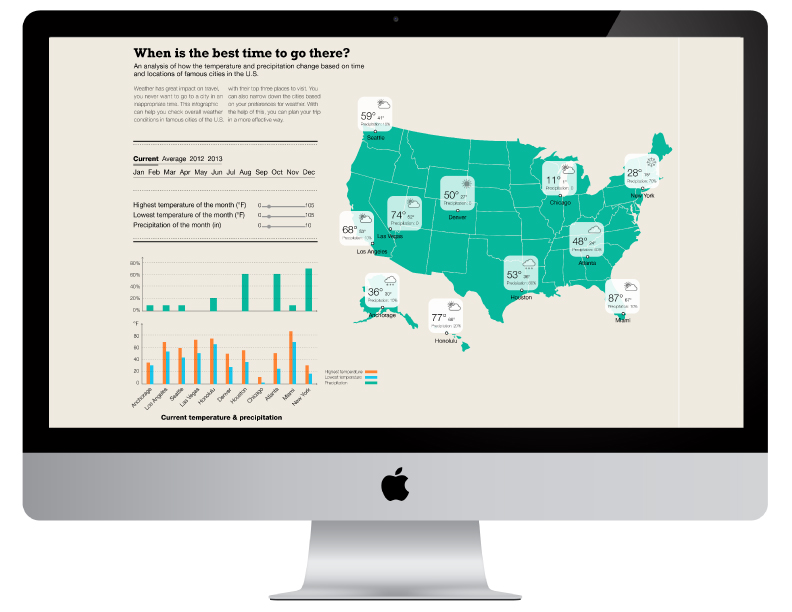
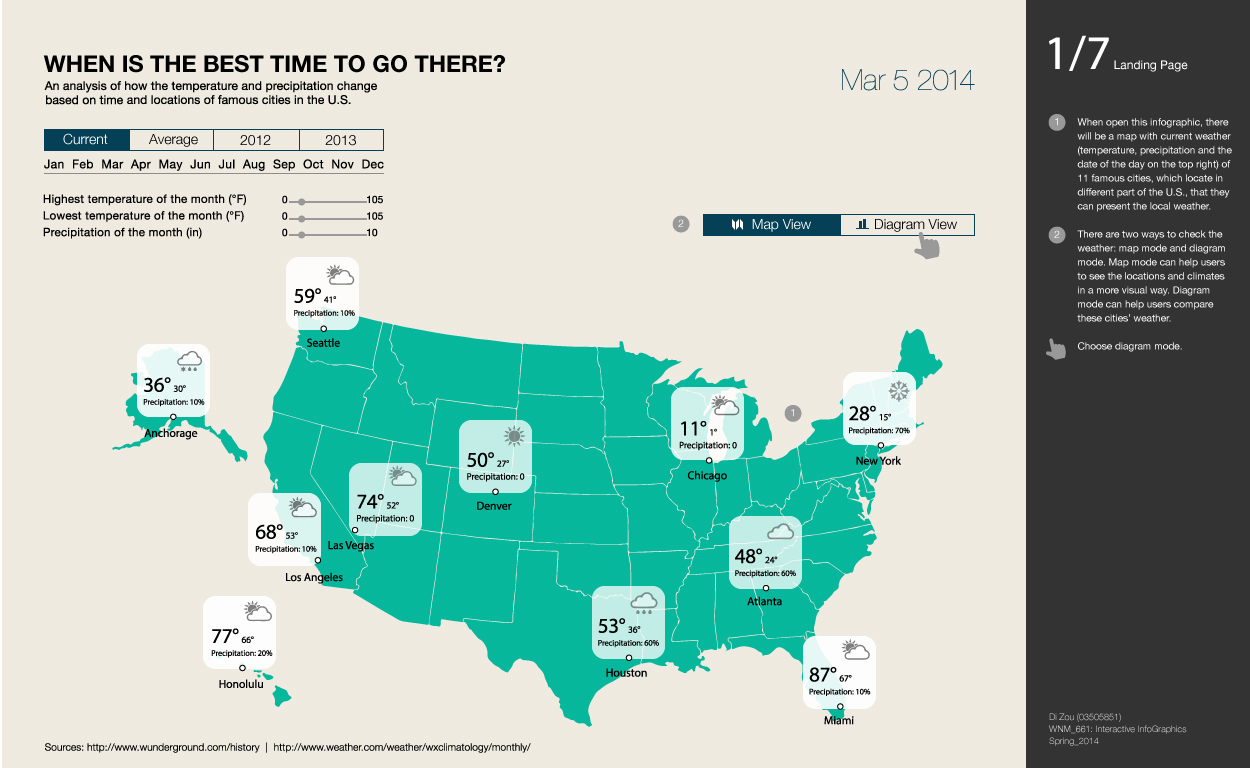
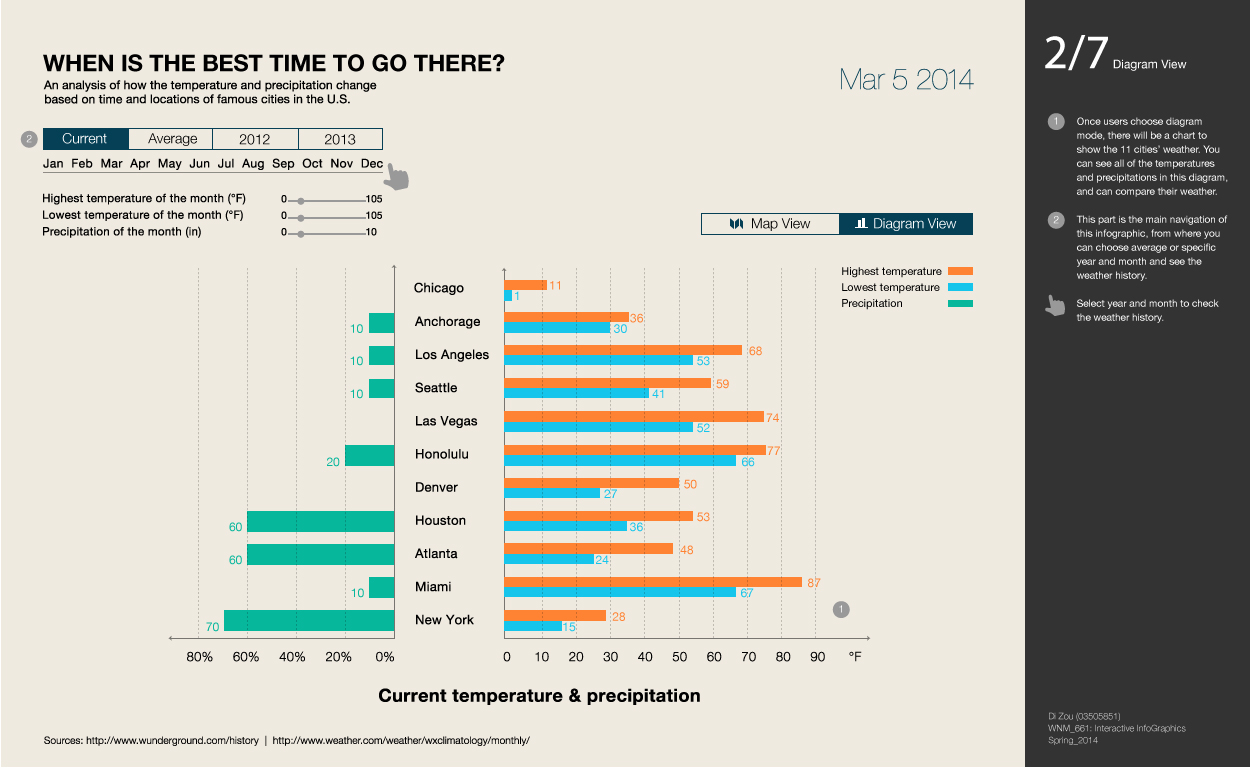
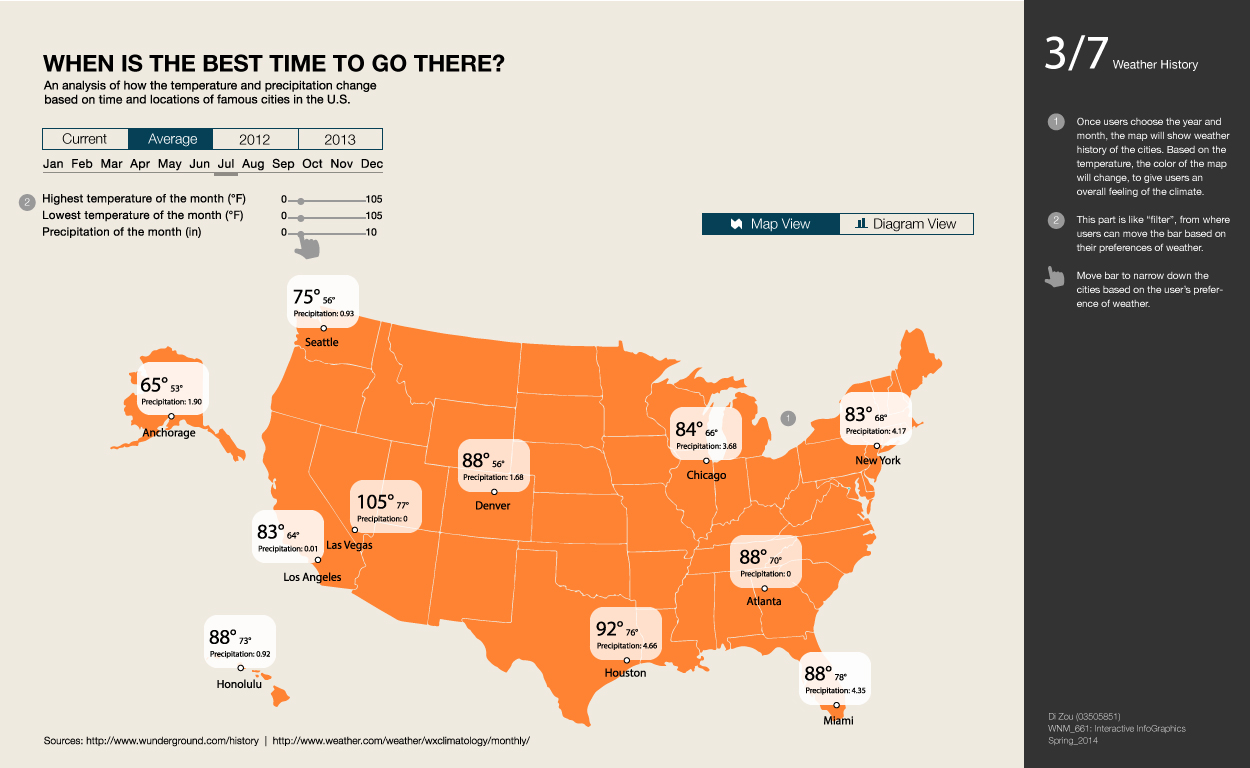
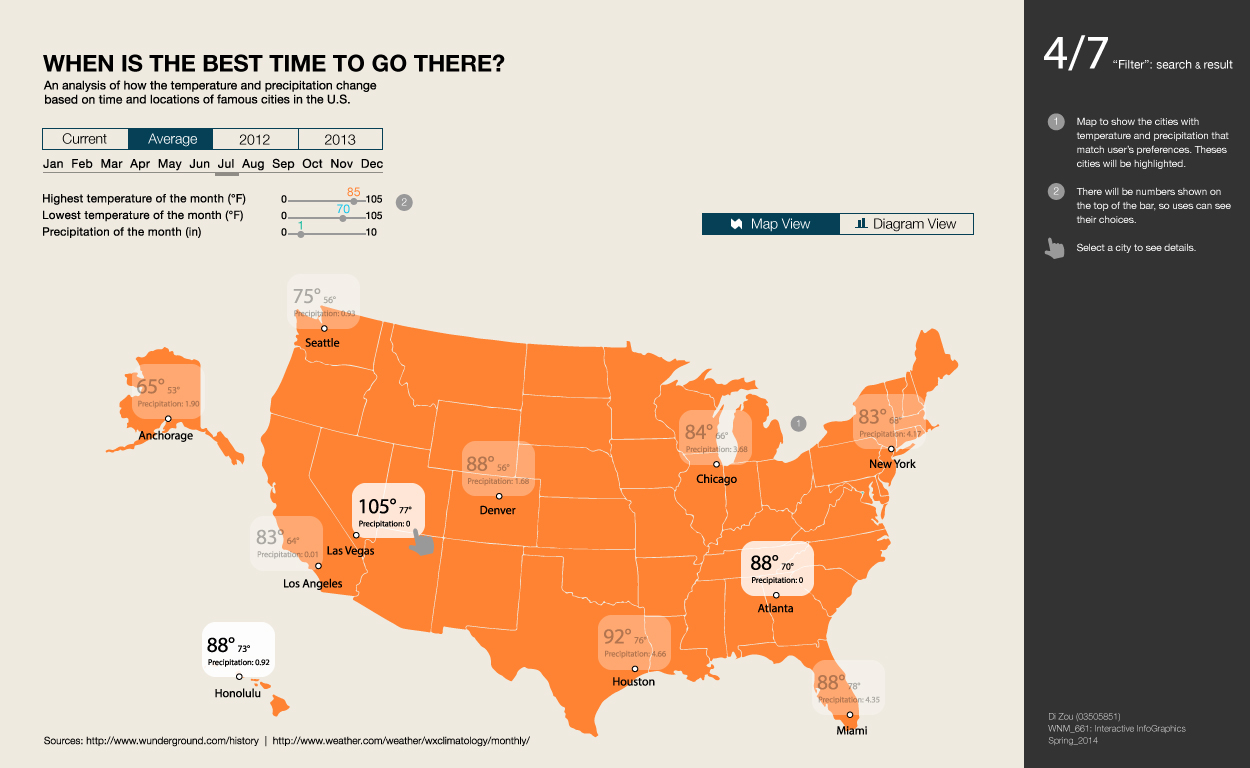
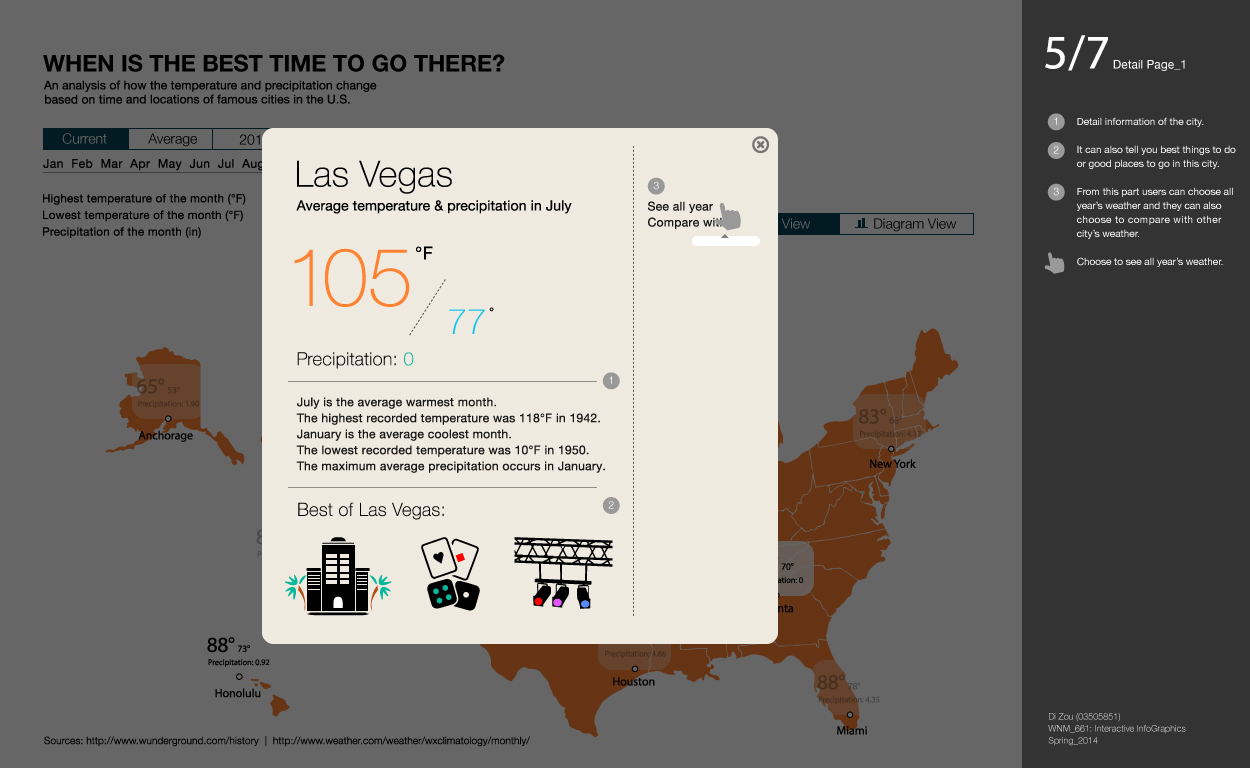
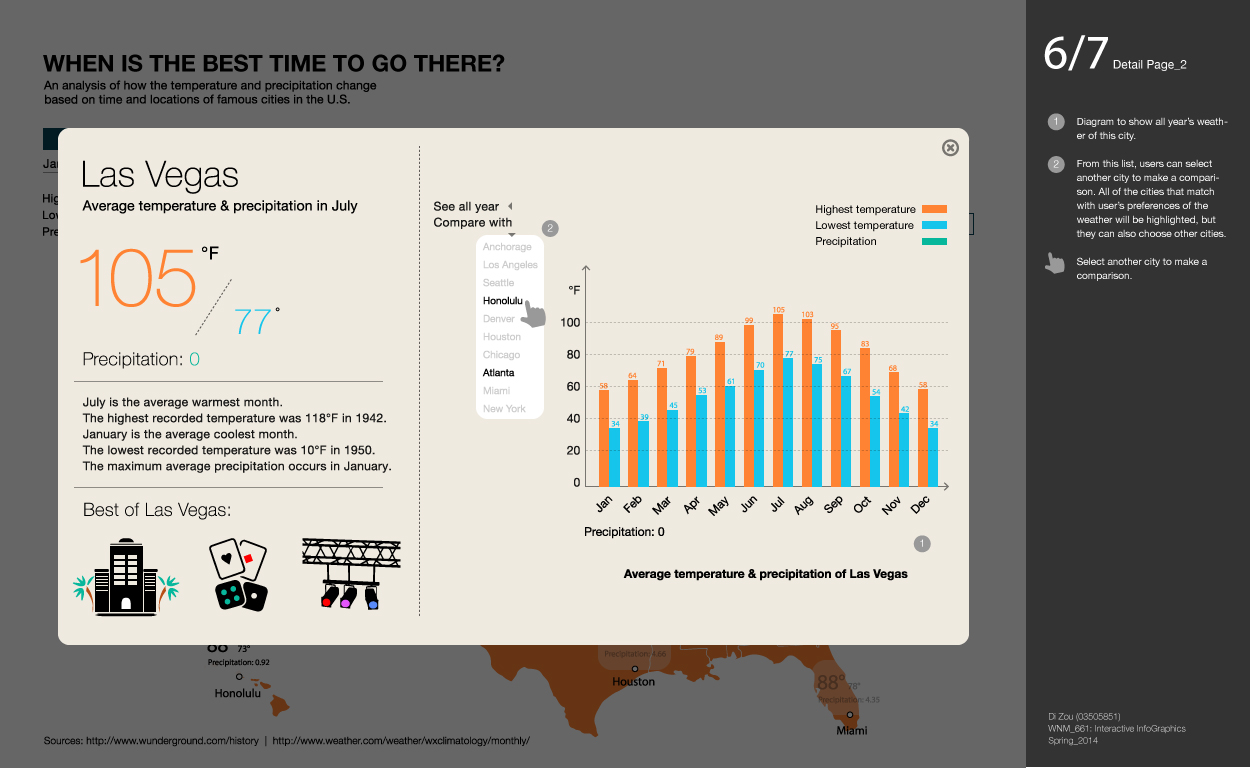
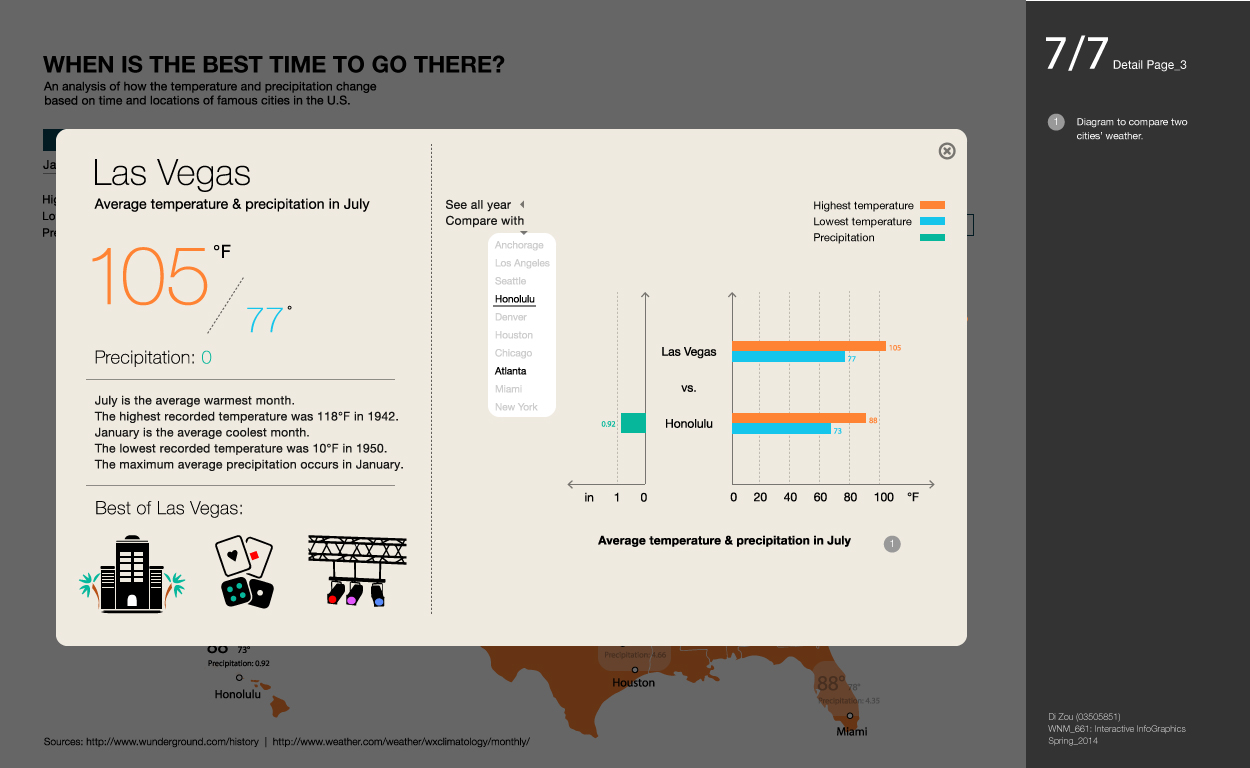
Visualize big cities' climate change.
“Average Monthly Temperature with Rainfall & Snowfall Statistics in Big Cities in America” uses the dataset to illustrate how the temperatures change based on seasons in big cities of American and how do they affect the number of rainfall and snowfall of those cities. Further investigations include: What else can affect the temperature, rainfall and snowfall of each city and how do they work together to create the climate difference for the city.